
Knowing what your coins are worth is easy. Knowing whether you are actually up is not, because it depends on what you paid, and most people bought in pieces at different prices.
This page explains how Moonitor works out profit, and how to record your trades so the answer means something.
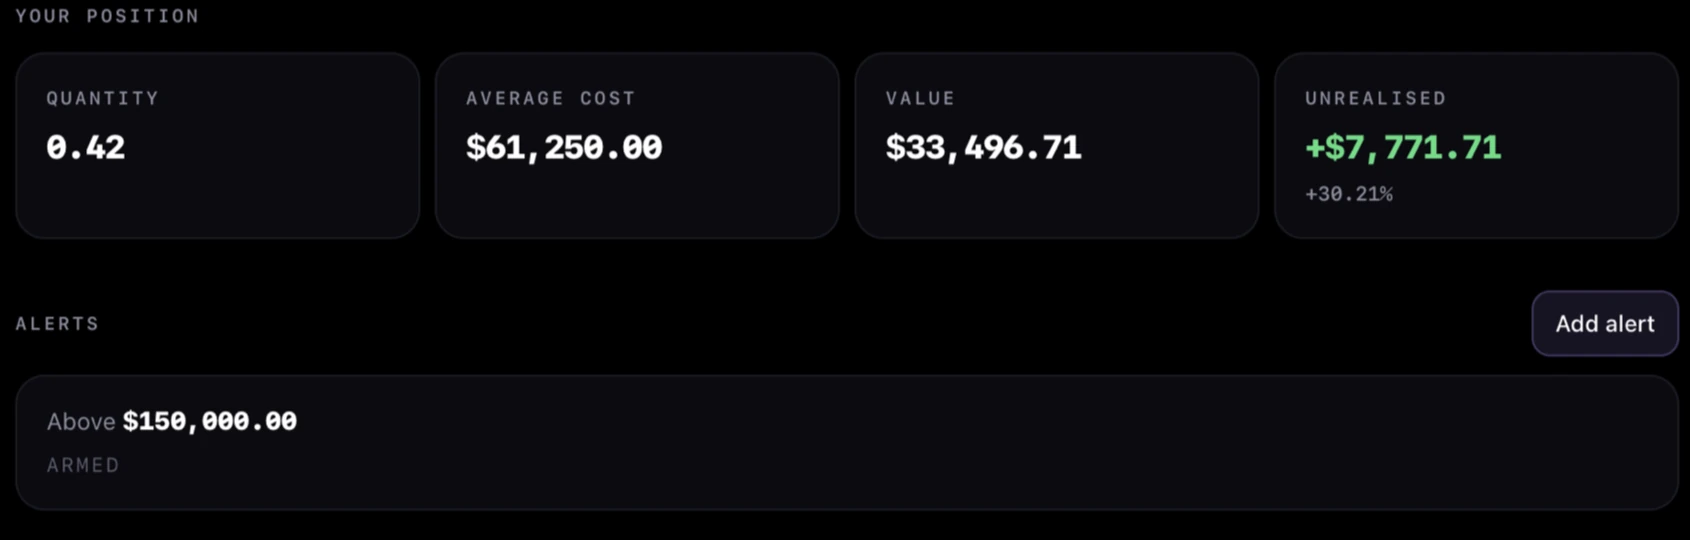
The one number everything rests on: what you paid on average
Say you bought Bitcoin three times:
- 0.1 BTC at $20,000, so $2,000
- 0.2 BTC at $30,000, so $6,000
- 0.1 BTC at $60,000, so $6,000
You have 0.4 BTC and you spent $14,000. Your average cost is $14,000 divided by 0.4, which is $35,000 per coin.
That single number is what "am I up" is measured against. It is not the price of your first buy, and it is not the price of your last one. Moonitor works it out for you and draws it as a dotted line straight on the coin's chart, so the gap between what you paid and what it is worth today is something you can see rather than calculate.
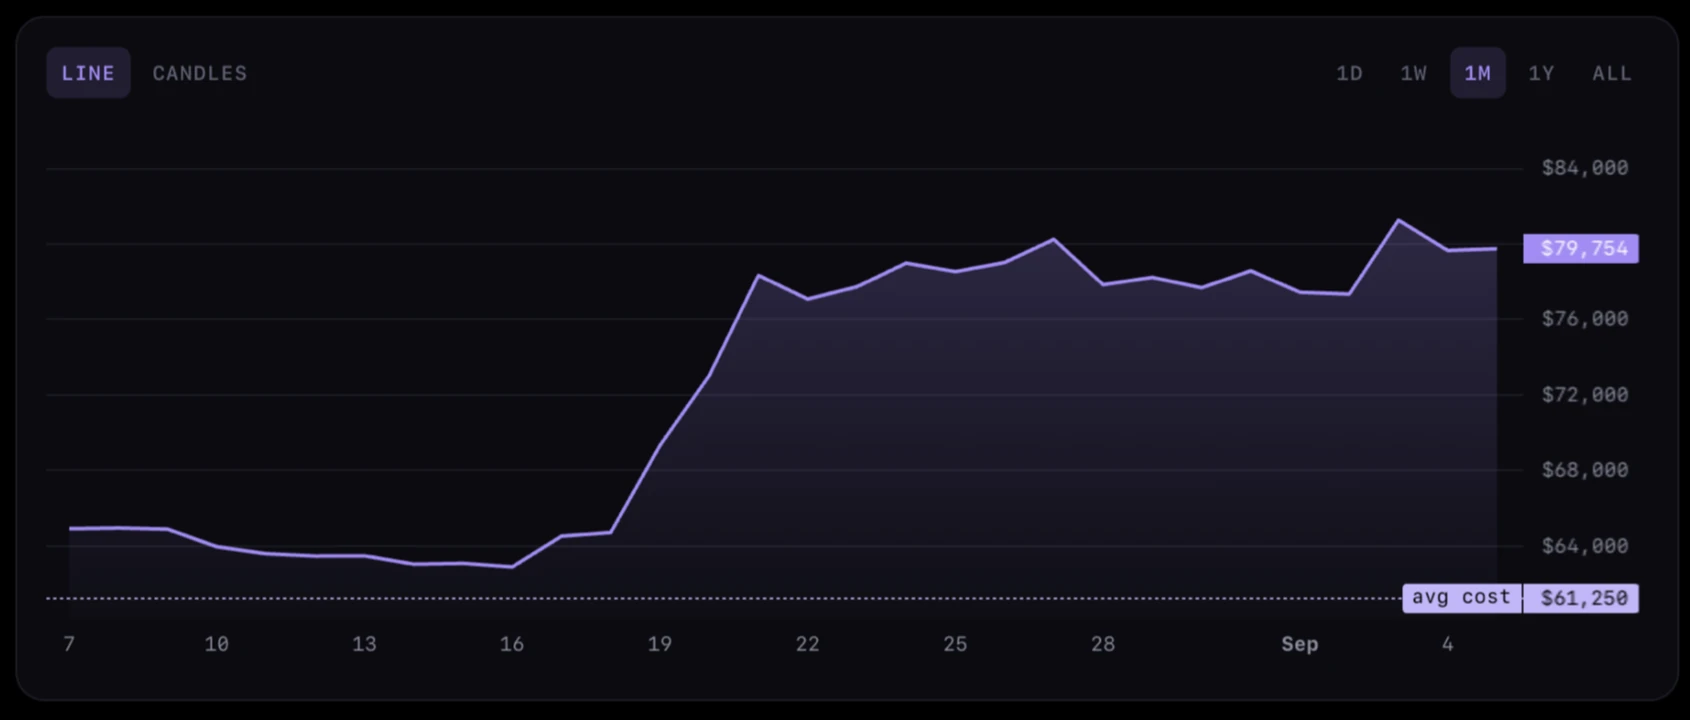
Profit you have not taken yet
At $50,000 a coin, your 0.4 BTC is worth $20,000. You spent $14,000. You are up $6,000, or about 43%.
That is unrealised profit: real on paper, not in your pocket. It changes every time the price moves, and it is the figure on the Portfolio screen next to each coin.
Profit you have taken
Now sell 0.2 BTC at $50,000 for $10,000.
Those 0.2 coins cost you $35,000 each on average, so $7,000. You made $3,000, realised. That is banked, and it never changes again no matter what Bitcoin does afterwards.
You still hold 0.2 BTC, and the average cost of what is left is still $35,000. Selling some of a position does not change what the rest cost you.
Moonitor keeps the two apart on purpose, because they answer different questions. Unrealised profit asks how the market is treating you today. Realised profit asks how your decisions have actually turned out.
Where to find each one
The Activity screen collects the realised half:
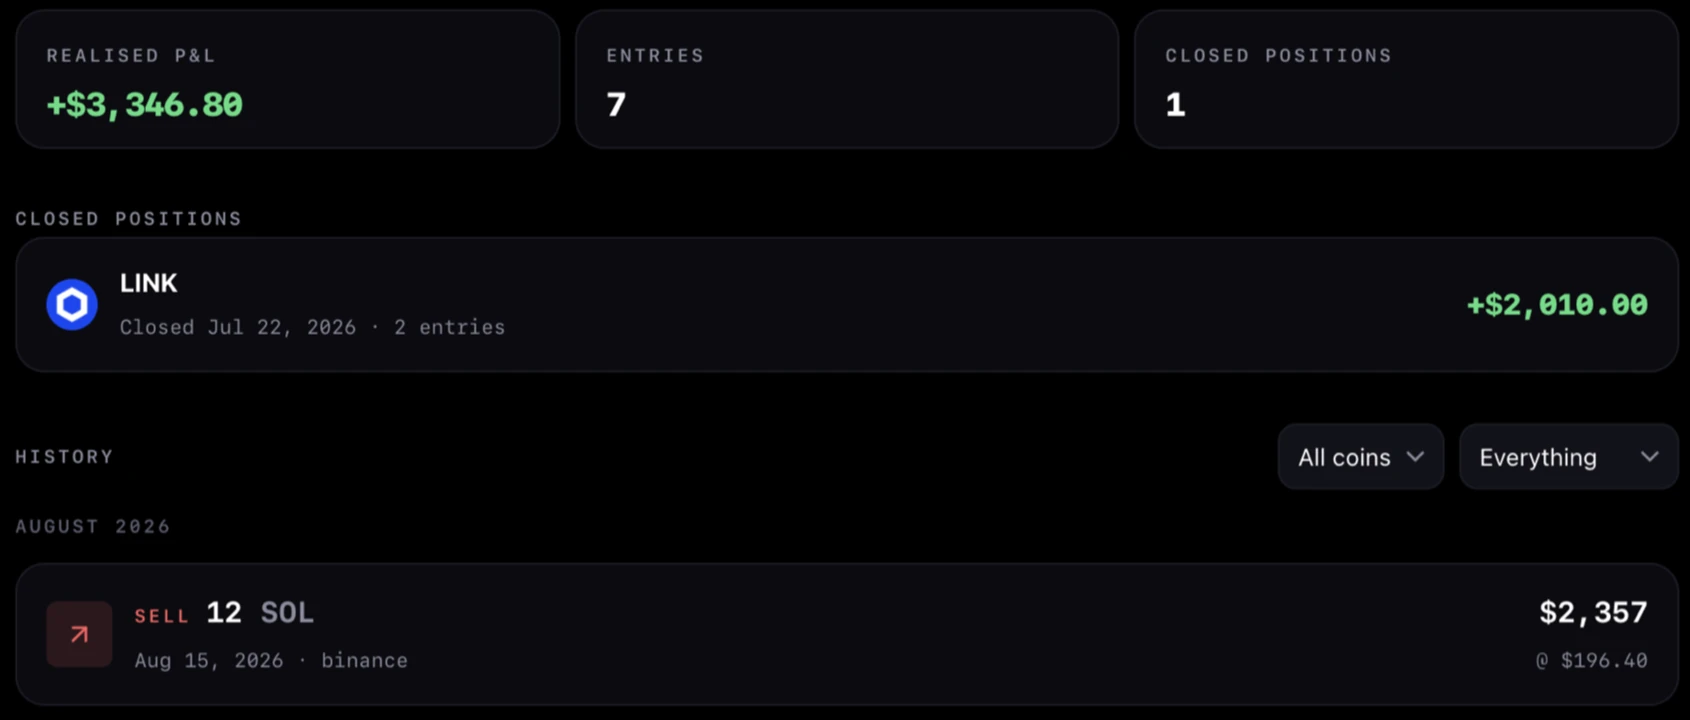
- Realised P&L, the total profit on everything you have sold
- Closed positions, every coin you sold out of completely, with what you made on each
- The full history, filtered by coin or by type
The Portfolio screen holds the unrealised half: what each coin is worth now against what it cost.
The percentage most trackers get wrong
There is one more number: how your whole portfolio has performed over a stretch of time. It looks simple and almost nobody calculates it correctly.
The naive way is to take the value at the start of the month and the value at the end. But if you added $10,000 half way through, that shows up as a huge gain. It is not a gain. It is a deposit.
Moonitor takes money in and out of the calculation before measuring, so the percentage reflects how your holdings performed rather than how much you paid in. The difference is not small: on a real portfolio a mid-month purchase once turned a modest month into a reported +750%.
The chart follows the same rule. It values the coins you actually held on each day, so the line agrees with the figures beside it rather than telling a separate story.
Getting the numbers right
The numbers are only as good as what you tell the app.
Record every buy, at the price you paid. Missing a purchase makes your average cost wrong, which makes every profit figure after it wrong too.
Record sells as sells. Deleting a purchase to reduce your holdings destroys the history, and with it the profit you made. Record the sale instead.
Record transfers as transfers. Coins you moved between wallets, were paid in, or were given, changed what you hold without being a trade. Moonitor has Transfer in and Transfer out for exactly this. Entering a transfer as a buy at zero invents a profit you never made.
Use real dates. The date decides which purchases are still open and where the chart begins. An approximate date beats today's date on an old purchase.
Include fees where they matter. On a large trade a fee is a rounding error. On many small ones it adds up, and it is part of what the coins cost you.
A note on tax
Moonitor calculates average cost, which is what you want to see day to day and is the accepted method in several countries.
Your tax authority may require something else, most often first-in-first-out, where each sale is matched against your oldest purchase. The two give different answers on the same trades. Export your transactions and give them to whoever does your taxes rather than copying a profit figure off a screen.
